Introduction
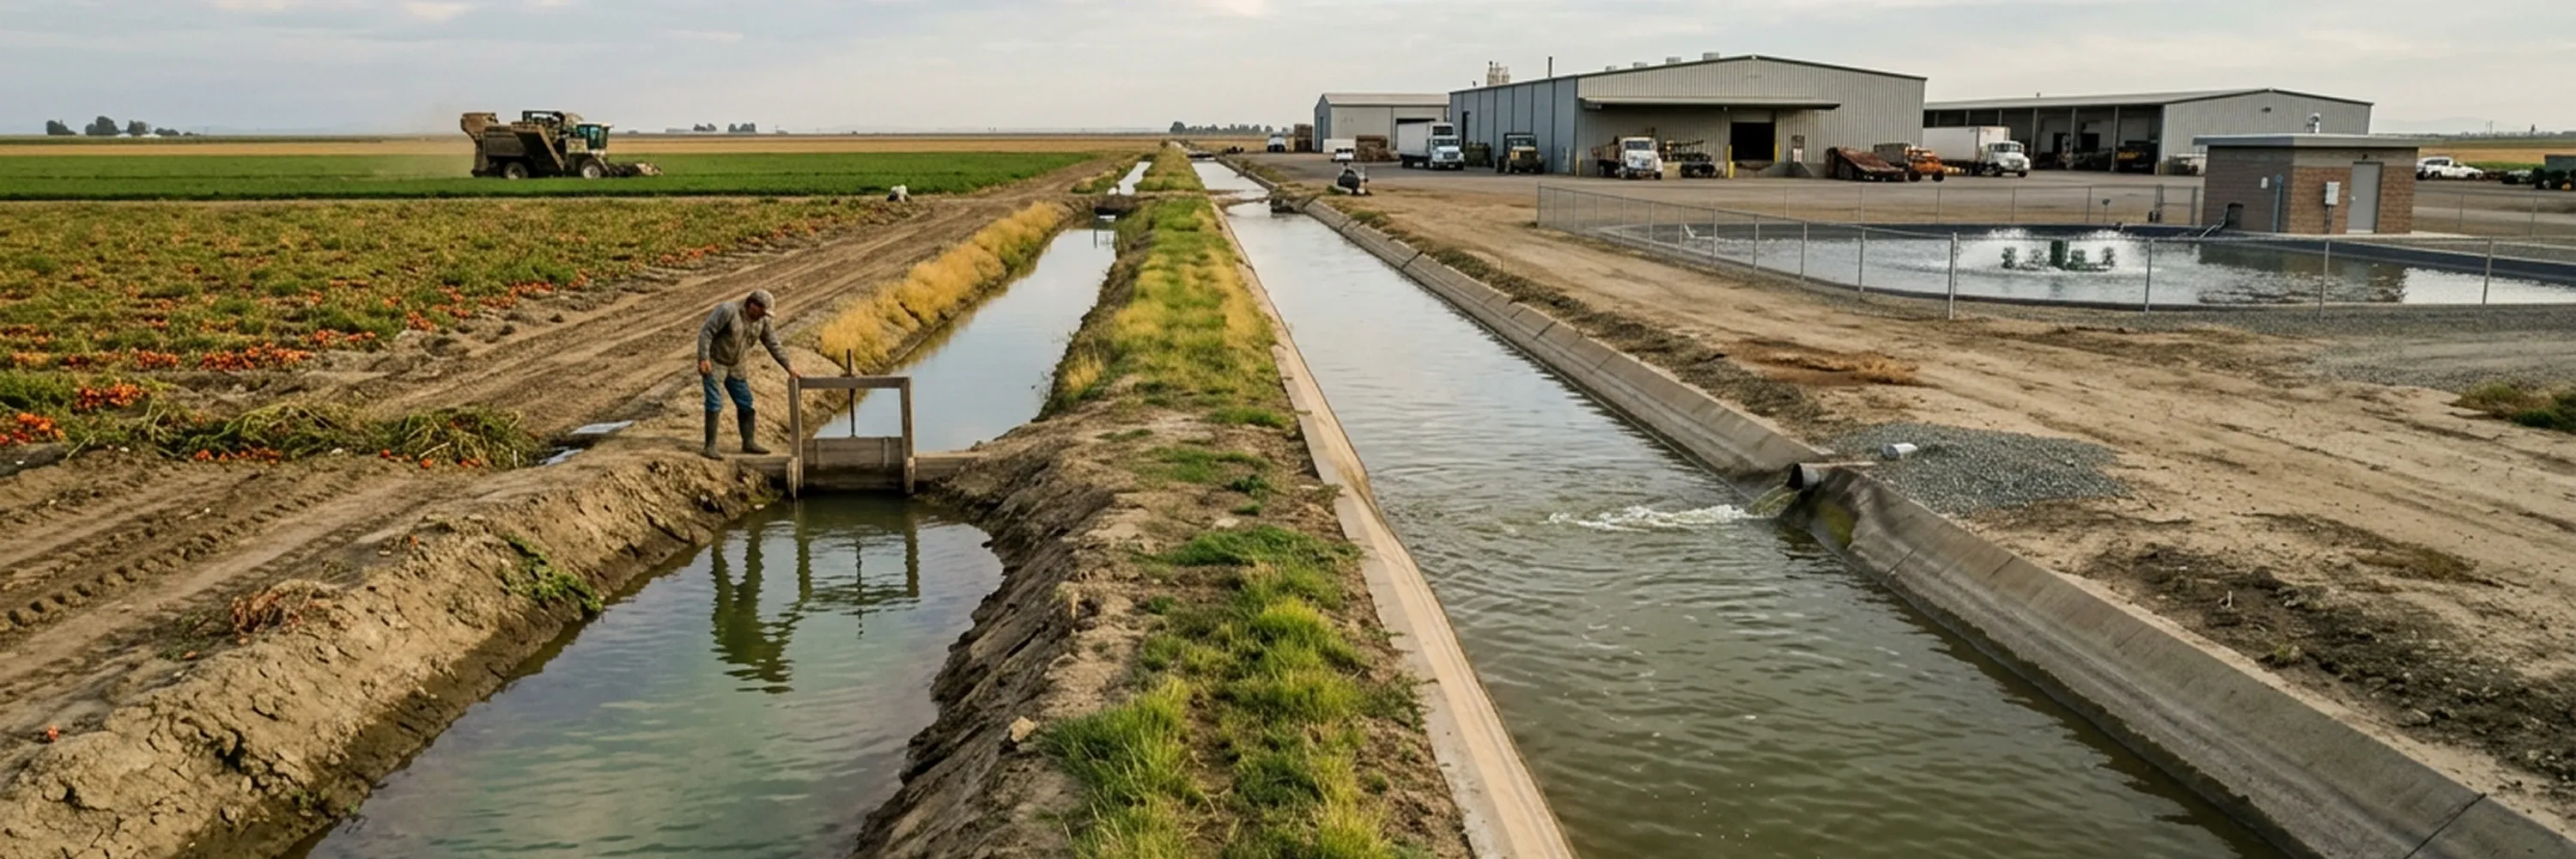
Water treatment systems across the MENA region generate satisfactory compliance paperwork, but they face contamination issues when organic matter consumes available chlorine before the chemical reaches pathogens. Facility operators often dose chemicals based on expected microbial loads rather than the actual organic burden present in the source water.
Operators deal with organic contamination from agricultural runoff, decaying vegetation, municipal discharge, and aging infrastructure simultaneously, and these sources create compounding loads that standard compliance testing often misses. Operators measure total organic carbon in water to solve this problem because the measurement reveals the precise amount of fuel that feeds microbes and depletes chemical agents.
This specific metric represents the driver of chlorine demand during treatment processes, as researchers confirmed when they studied reservoir quality changes. Facility managers rely on this baseline to determine whether their planned chemistry will succeed or fail before any treatment begins. This discussion explores how this measurement framework helps facility managers change daily operations into a predictable and evidence-based practice.
Total Organic Carbon in Water as Ultimate Pre-Disinfection Metric
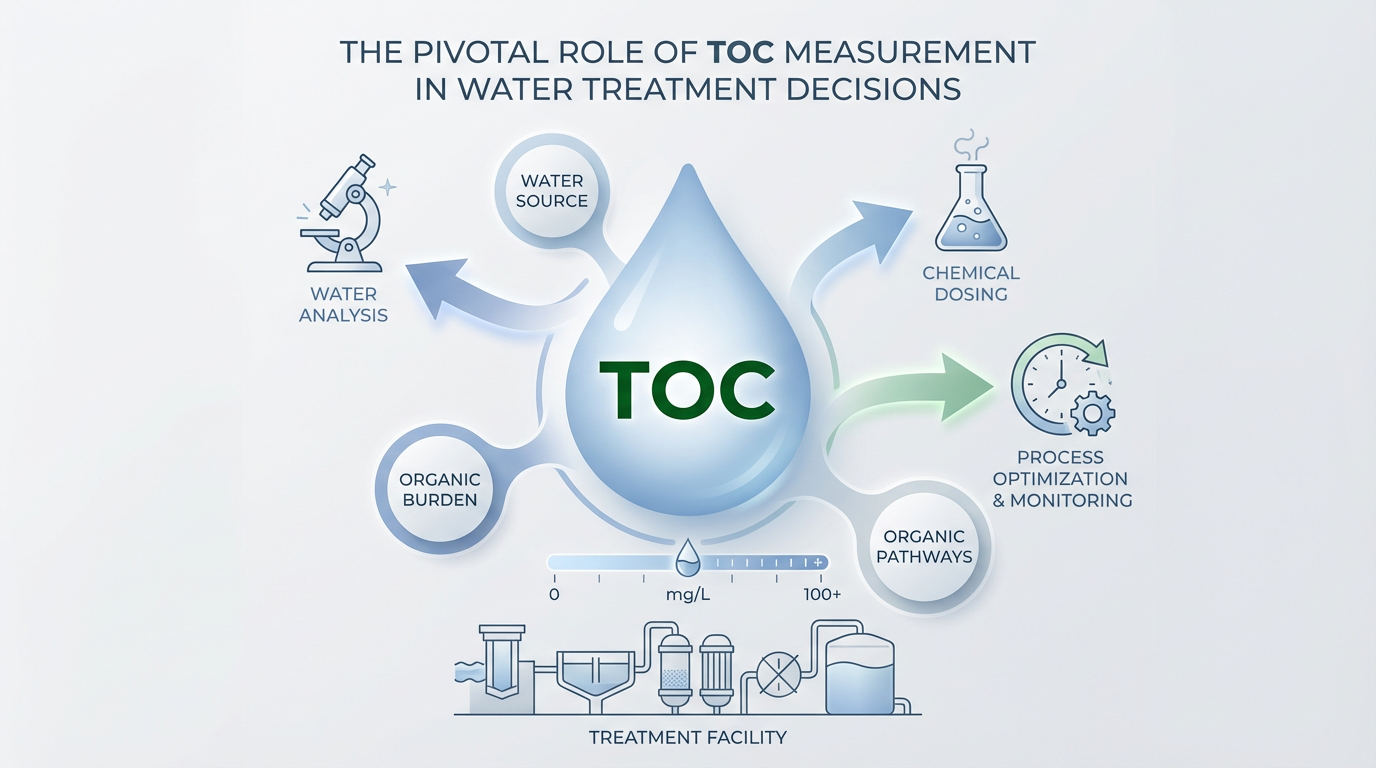
Total organic carbon (TOC) represents the sum of every carbon-bearing organic compound present in a water sample and expresses it in milligrams per liter. This single metric captures the cumulative organic burden from agricultural chemicals, decomposing plant material, municipal effluent, and infrastructure decay all at once. Narrower indicators miss critical dimensions of this burden. For example, turbidity measures suspended particles but ignores dissolved organics entirely. Similarly, coliform counts offer a snapshot of microbial presence at the moment of sampling but reveal nothing about the growth potential that dissolved carbon fuels over subsequent hours and days.
A thorough water analysis that relies on filtration and oxidation principles begins with establishing how much organic fuel the source carries. Without that number, every downstream decision about which disinfectant to use, how much to dose, and how long to maintain contact time lacks a factual anchor.
Treatment facilities often select chemistry based on historical averages or manufacturer recommendations rather than the actual condition of the water that flows through their system at that moment. Accuracy in treatment starts with accuracy in measurement, and certainty about disinfection outcomes requires a known organic load because this load enters the system through four specific pathways.
Four Major Pathways of Regional Organic Contamination
Regional water sources rarely face a single contamination challenge. Four distinct pathways deliver organic matter into rivers, reservoirs, and aquifers simultaneously, and their combined effect overwhelms treatment protocols that rely on static assumptions.
-
Agricultural runoff sends fertilizers, pesticides, and loose sediment with irrigation return flows and storm events into surface water and shallow aquifers. Nitrogen and phosphorus compounds are highly mobile, while pesticide residues attach to sediment particles or dissolve directly into runoff channels.
-
Decaying vegetation occurs when extreme regional heat accelerates plant decomposition and releases tannins and humic acids into water bodies. Flash rainfall events then flush accumulated organic debris in concentrated pulses and create sudden spikes that can persist for days.
-
Municipal discharge from treated wastewater still carries pharmaceutical residues, personal-care-product metabolites, and microbial byproducts that conventional treatment plants do not fully remove. These compounds add a persistent organic baseline that treatment facilities must account for year-round.
-
Distribution infrastructure decay happens when aging pipes develop internal biofilm that consumes residual disinfectant and sheds organic matter back into finished water. The infrastructure itself becomes a secondary contamination source and creates a feedback loop that erodes treatment effectiveness from the inside.
These pathways combine with seasonal unpredictability. A single surface water system that faces multiple contamination vectors can experience compounding organic loads that shift week to week. Airport stormwater monitoring documented cases where de-icing chemicals escalated TOC from 20 mg/L to 240,000 mg/L after sudden weather events.
Agricultural and municipal runoff events do not reach those extremes, but they do produce spikes severe enough to consume an entire chlorine dose before a single pathogen is neutralized. Identifying these sources precisely and understanding their seasonal behavior help predict chemical doses and reduce organic contamination under real operating conditions.
Chemistry of Prediction for Chemical Doses
Chlorine does not distinguish between an organic molecule and a bacterium. When it enters water, it reacts preferentially with carbon-bearing compounds and breaks them apart before any residual oxidative capacity remains to attack pathogens. This oxidation-demand mechanism means that the organic load dictates how much disinfectant is consumed before treatment even begins.
The relationship between total organic carbon in water and chlorine consumption is not linear. Research on reservoir water quality found that chlorine demand increases sharply once TOC exceeds 1.60 to 1.96 mg/L. A source that rises from 2 mg/L to 4 mg/L after a runoff event does not just double the chlorine demand. This rise can trigger a disproportionate spike that renders past dosing rates fundamentally inadequate.
The consequences extend beyond failed disinfection. When chlorine reacts with organic precursors instead of pathogens, it generates disinfection byproducts such as trihalomethanes and haloacetic acids. Recent water analysis has uncovered an even more concerning class of byproducts. Researchers found that the EC50 values of eight haloaniline compounds were significantly lower than currently regulated disinfection byproducts, and the lowest toxic concentration of 2-chloro-4-nitroaniline measured at just 1 μM and was 500 times lower than dichloroacetic acid.
These findings underscore the soundness of measuring organic load before adding chemicals. If the TOC baseline is known, treatment facilities can calculate whether their planned chlorine dose retains enough residual capacity to inactivate pathogens after it satisfies organic demand. The reliability of that calculation determines whether the system actually protects water or experiences operational failures that hide behind paper compliance.
Paper-Compliance Trap and Real Operational Failures
A system can pass every scheduled test and still fail to protect water between sampling events. This scenario represents the paper-compliance trap, and it catches facilities that treat total organic carbon in water as a simple metric rather than a signal for immediate action.
Quarterly TOC sampling that pairs with weekly coliform testing produces documentation that satisfies regulatory review. However, a contamination spike from regional runoff can enter the system, persist for days, consume available chlorine, and resolve entirely before the next scheduled sample collection. The paper trail shows compliance with standards while the system experiences an undetected organic reduction failure. The distinction between passing an audit and maintaining continuous protection is the distinction between documentation and operational trust.
Continuous or high-frequency TOC monitoring closes this gap. Pharmaceutical manufacturers demonstrated this principle when real-time data allowed them to optimize purification processes because they responded to organic fluctuations as they happened rather than reviewed them after the fact. When facilities pair frequent TOC readings with standard microbial testing, the combination creates an early-warning framework.
An increase in TOC alongside stable microbial counts signals that the system consumes chlorine and failure approaches. An increase in TOC alongside an increase in microbial counts signals active failure. A stable TOC alongside an increase in microbial counts points to distribution-system problems like biofilm accumulation or dead-leg stagnation. Each pattern demands a different response, and confidence to choose the correct response depends on the availability of organic carbon data in real time rather than weeks after the event.
Application-Specific Risk Implications and Thresholds
The same organic carbon reading carries different consequences because water usage dictates the impact. A 3 mg/L TOC reading poses manageable risk in an open-field irrigation canal. However, that identical reading in a closed hydroponic system or a warm cooling loop creates conditions for biofilm colonization and pathogen proliferation. Effective water analysis requires facilities to match the measured organic load against the specific threshold for the highest-risk application on site.
Each application category follows specific logic for threshold placement.
-
Drinking water. Lebanese compliance standards restrict TOC levels to minimize disinfection byproduct formation and limit microbial regrowth potential in distribution networks. Modest organic concentrations generate trihalomethanes when facilities apply chlorine, and this requires source carbon reduction.
-
Irrigation. Open-field systems tolerate 3–4 mg/L. Closed hydroponic operations need levels below 1–2 mg/L because dissolved organics feed biofilm that clogs drip emitters and harbors plant pathogens in root zones.
-
Food processing. Water that contacts produce or sanitizes equipment must maintain low TOC so that residual disinfectant survives organic demand. Food industry water treatment carries the added constraint that any formed byproducts could end up in the final product.
-
Cooling systems. Legionella biofilm thrives on organic matter in warm water between 25–40 °C. Typical TOC limits for cooling circuits fall in the 1–5 mg/L range. Culture test results take days to return from the lab, and this makes TOC-based early warning the only real-time safety indicator.
Industrial facilities that process water that exceeds 30 mg/L TOC have diverted entire flows into storage ponds to avoid overwhelming treatment chemistry. Facilities that serve multiple applications from a single source must enforce the most stringent threshold that matches their highest-risk use. This happens because organic reduction that targets the tightest limit automatically satisfies every lesser limit and establishes a foundation for predictive management workflows.
Predictive Management Workflows
Static dosing schedules incorrectly assume that source water behaves the same way week after week. Adaptive operations replace fixed protocols and use total organic carbon in water as a live decision variable rather than a filed data point. Facilities establish a reliable organic baseline and define event-driven trigger points. These trigger points include pre-storm thresholds or peak summer decomposition windows.
This approach helps facilities anticipate contamination instead of reacting to it. This transition does not require expensive automation to begin. A structured sampling protocol and pre-calculated dosing adjustments ensure that treatment chemistry matches actual conditions when those conditions change.
Routine Water Analysis for Baselines
Seasonal patterns repeat with enough consistency that even basic laboratory capacity reveals them. Facilities that collect weekly or biweekly TOC readings over a full annual cycle build a reliable dataset. This dataset maps organic loading against irrigation schedules, rainfall events, and temperature shifts. This dataset becomes the foundation for precision in dosing decisions.
When historical data shows that post-storm TOC reliably doubles, personnel calculate the corresponding chlorine or ozone adjustment in advance and deploy it the moment weather forecasts trigger the protocol. Pharmaceutical manufacturers demonstrated this principle when predictive maintenance insights emerged from TOC data, and this helped teams anticipate equipment issues before they escalated. The same logic applies to any water system.
Advanced Technology for Better Organic Reduction
Online TOC analyzers and catalytic ozone systems use agricultural-waste-derived biochar to improve predictive water management tools. Online analyzers feed continuous organic carbon readings directly into dosing controllers, and this eliminates the lag between sample collection, lab analysis, and human response. Catalytic ozone enhancement increases oxidation efficiency per unit of ozone. This higher efficiency lowers chemical consumption and reduces byproducts at equivalent disinfection performance.
These technologies confirm the foundational principle that requires facilities to measure the organic load first and let the chemistry follow. Sensor costs decline and integration with automated dosing platforms matures. This progress narrows the gap between basic laboratory protocols and fully adaptive treatment systems. The narrowed gap makes evidence-based carbon management accessible for a single greenhouse operation or a regional distribution network that must prepare for emerging threats and regulations.
Preparedness for Emerging Threats and Regulations
Regulatory agencies expand their scrutiny well beyond the contaminants that current compliance frameworks address. The United States Environmental Protection Agency draft Sixth Contaminant Candidate List includes 75 specific chemicals, four chemical groups, and nine microbes for future regulation consideration.
The draft lists various priority groups for the first time, and these groups include microplastics, pharmaceuticals, per- and polyfluoroalkyl substances, and disinfection byproducts. Each of these emerging concerns traces back to organic matter. Pharmaceuticals exist as organic compounds. Microplastics adsorb organic contaminants onto their surfaces and transport them through treatment barriers. Novel disinfection byproducts form when chlorine reacts with organic precursors that previous monitoring generations never targeted.
Climate change adds another dimension. Changes in rainfall intensity and prolonged heat waves alter both the timing and the magnitude of organic loading into surface water and shallow aquifers. Treatment systems that rely on historical averages face conditions that those averages no longer describe.
These converging pressures share the organic carbon concentration in the source water as a common upstream variable. Facilities address the root cause when they reduce that concentration before they apply disinfection chemistry. This proactive strategy prevents the need to chase individual contaminants one regulation at a time. This foundation creates certainty in operational planning. When facilities control the organic precursor pool, they secure the most durable safety foundation available, regardless of which specific compound receives regulatory attention next.
Conclusion
To summarize, measuring total organic carbon in water changes disinfection from a fixed routine into a predictive and evidence-based practice. Pre-dosing evaluations of organic load prevent operational failures and contamination. As regulatory frameworks expand their scrutiny to include microplastics, pharmaceuticals, and highly toxic disinfection byproducts, reducing organic matter at the source establishes a strong foundation for maintaining safe systems across irrigation, processing, and industrial applications.
Agritopia designs oxidation and filtration systems that address organic loading challenges. Reach out to schedule a consultation about implementing continuous monitoring and adaptive treatment protocols at your facility.